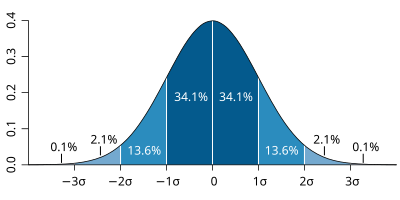
- make sure you want to utilize the graph you have chosen.
- interpret the data that is presented - you can make whatever point you want, just must be data driven. Point must tie agriculture to natural resource management issues.
- Did you need to do additional research to interpret the graph? What were the additional resources you consulted.
- are there any associated statistics that help give the data meaning. (If you are unsure about what additional information statistics can provide see these examples)
- Is there potential bias in the graph? If so, how is it biased.
- What was the source of the data? how big was the study? etc.
- What other sources of data might be useful?
Make sure you answer each of the questions above and hand in the assignment with a copy of your graph by Friday, March 18th.